Solar energy in public transport
- Articles and technical information
- Articles
 Since there are now frequent projects that seek to use solar panels to power signage and other public transportation information systems, we decided to summarize in this article the facts and possibilities about this type of power supply and its potential for failure. Our aim is not to define the methods of calculating and sizing the equipment, but to point out the suitability/unsuitability of this solution. Therefore, the calculations presented here have "some" freedom. However, the result is consistent with our experience.
The paper points out the characteristics of incident solar radiation and the possibilities of its real use for powering devices and the related use of batteries.
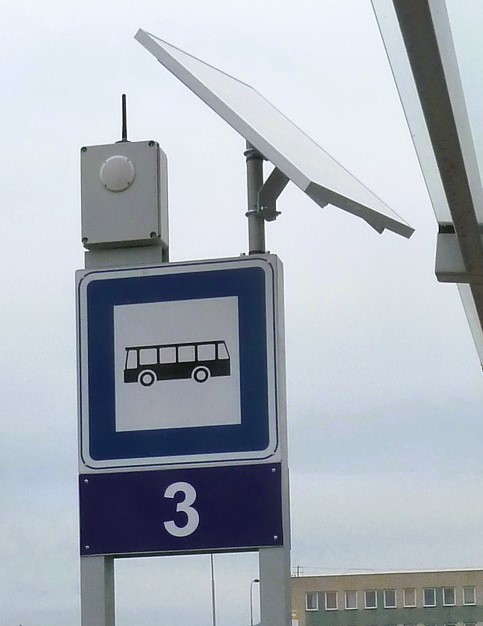
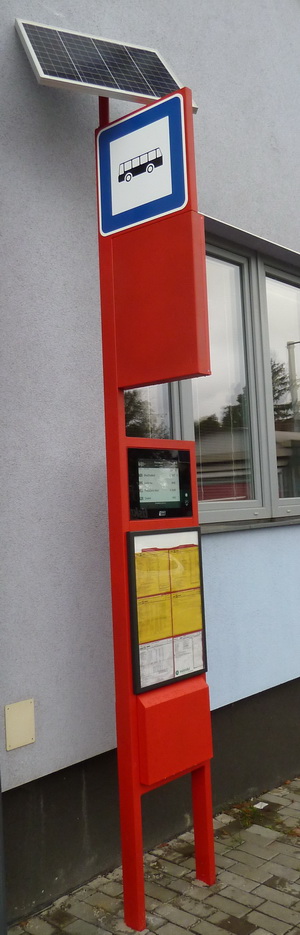
An example of a typical application is the stand-alone operation of an OAS 130 B-N acoustic beacon powered by a solar panel of "appropriate" size.
Updated 16.11.2020.
Properties of incident solar energy
Facts about incident solar energy:
- The power of the radiation incident on the surface of the Earth's atmosphere is approximately 1360 W/m2 when the surface is perpendicular to the radiation. Based on these facts, a map of the"Global Horizontal Radiation"(Author: SolarGIS © 2011 GeoModel Solar s.r.o., CC BY-SA 3.0, source: https://commons.wikimedia.org/w/index.php?curid=15360397) is produced, which shows how much energy is incident on different areas during the year.
- Overall, only about 17% of the incident energy can be converted into electricity by photovoltaic panels. This constant must be multiplied by the incident energy of the sun.
- The incident radiation is influenced by air pollution, cloud cover, altitude, morning fog and the inclination of the panel, which significantly reduce the usable solar energy.
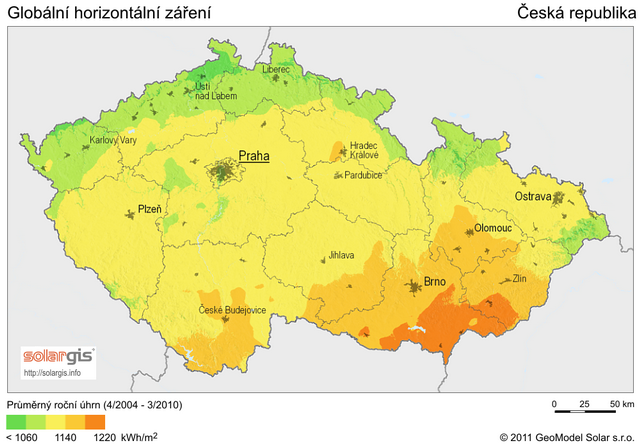
Global horizontal radiation and incident energy by region in the country.
Since our goal is not to produce energy for the purpose of selling it, but for the purpose of powering an autonomous device (e.g., a bus stop panel), other solar radiation characteristics must be addressed:
- Direct radiation - solarradiation that is neither reflected nor absorbed and re-radiated as it passes through the atmosphere. Its input occurs on a sunny day, i.e. when the full power of the panel can be counted.
- Diffuse radiation - Solar radiation that has been reflected by particles contained in the atmosphere (water droplets, dust...) and changed direction. The wavelength of this radiation remains the same as before the reflection. The amount of diffuse radiation depends on cloud cover and atmospheric pollution. These phenomena, in turn, reduce the amount of direct radiation and significantly reduce the electrical energy generated.
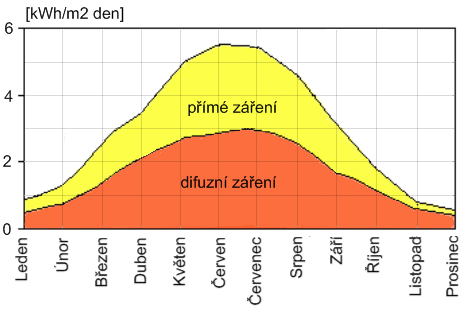
Direct vs. diffuse radiation under Czech conditions
Source: http://www.isofenenergy.cz/fotovoltaika.aspx
This graph basically tells us the ratio of sunny and cloudy days during the year and the energy they supply. However, it does not tell us its temporal distribution during the month, i.e. at what interval the cloudy and sunny days alternate.
This graph can be supplemented with another graph, and that is the number of sunny hours during the month (in this case in Brno):
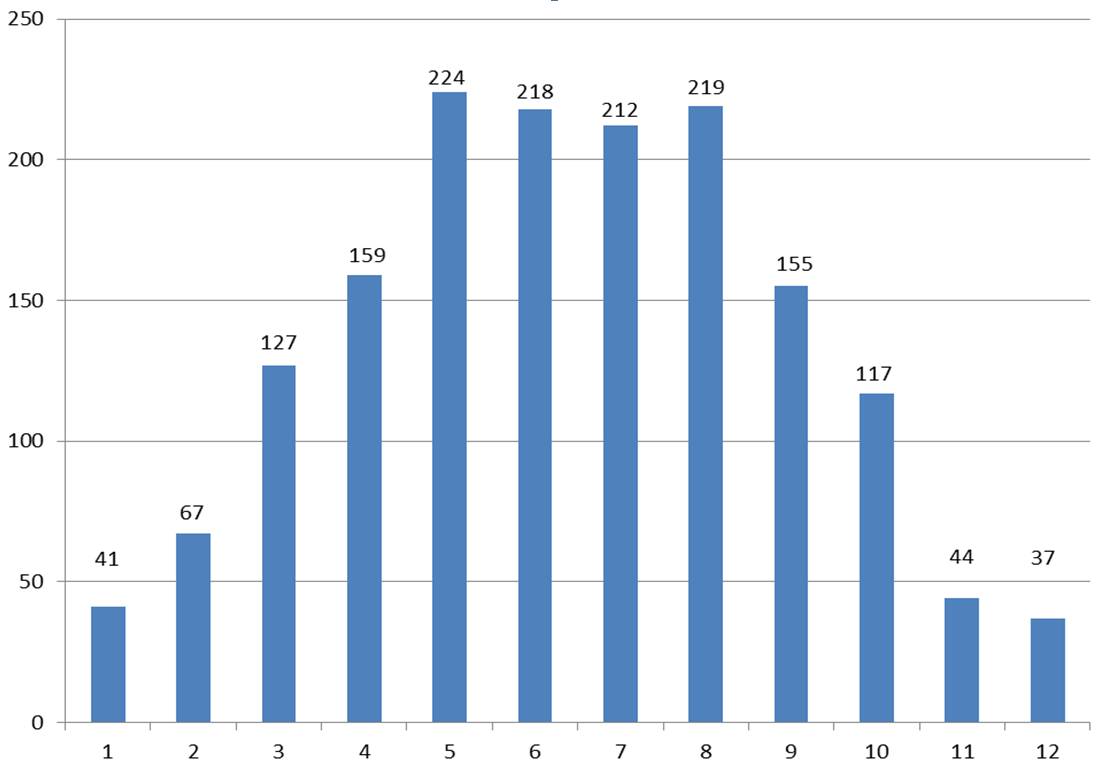
Number of sunny hours during the month in Brno
(taken from the book Beranovský,J. and Truxa,J. et al.: Alternative energy for your house).
This graph shows that in December, for example, there are only 37 hours of direct sunlight in Brno. This implies that in the month of December there are on average 5 sunny days and the rest is cloudy. Moreover, this graph says nothing about the distribution of sunny days, i.e. whether there were 5 "nice" days (direct radiation) in a month and then 26 "cloudy" days (diffuse radiation) or whether these hours occurred on days when it was partly cloudy. And if we go back to Chart 3, it shows that these 5 or so days of sunshine "supplied" about 25% of the energy for the month.
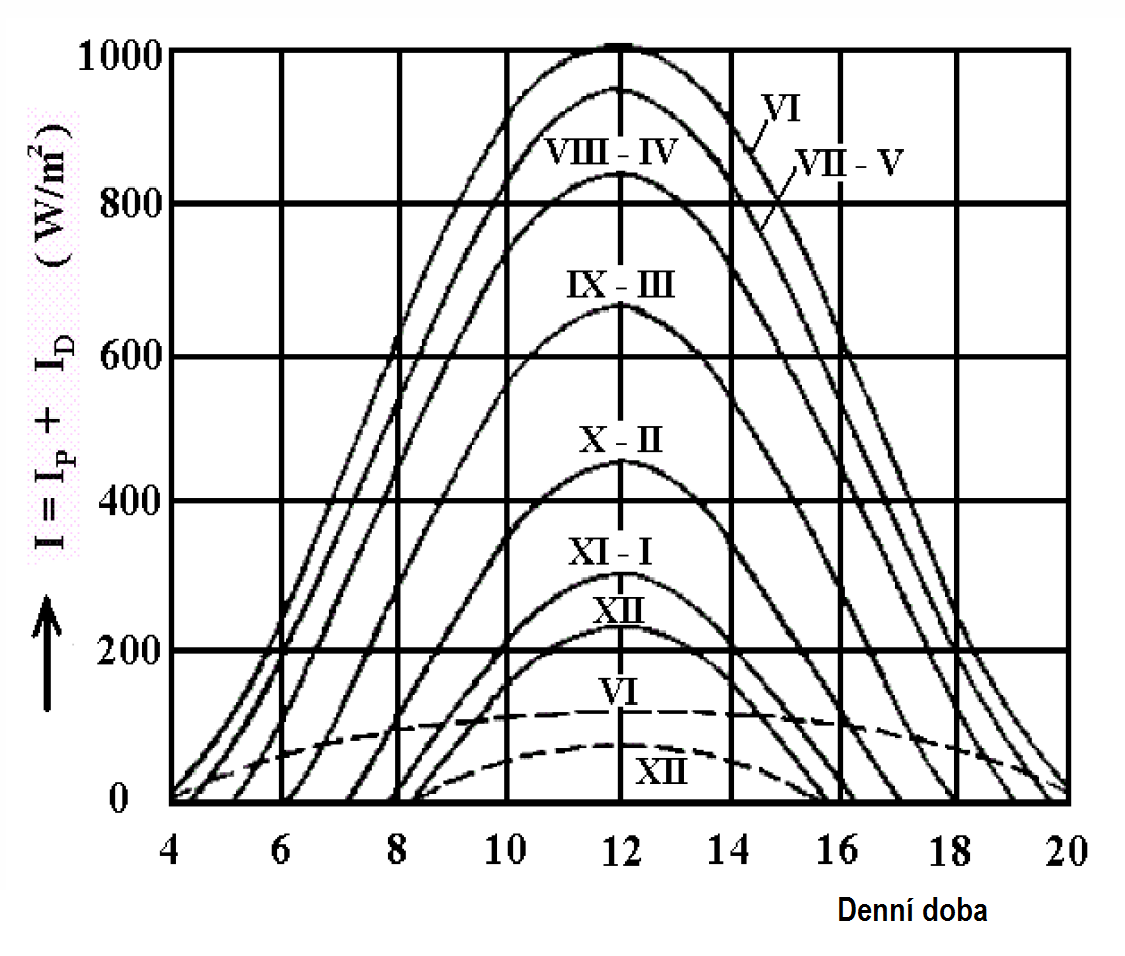
The last graph characterizing the sunshine is its pattern of solar energy impact during the day in different months of the year. It clearly shows that the most complex month in terms of solar power is December, when the maximum possible energy delivered is about 22% of the energy of June. Thus, Fig. 5 describes the evolution of the total solar radiation intensity per horizontal surface during the day time at an atmospheric pollution coefficient Z=3 for a latitude region of 50O. The individual curves show a characteristic day of the month in clear and sunny weather. The dashed line represents the pattern of diffuse radiation intensity in the months of June and December. Diffuse radiation in clear weather (by definition, it always occurs) does not generally exceed 100 W/m2, which is about 10% to 15% of the total radiation.
Solar energy incident during the day in different months of the year
(taken from Cihelka, J.: Solar heating systems. Prague : SNTL, 1984. 206 p.)
The preceding figure describes the evolution of the total solar radiation intensity per horizontal surface during the day at an atmospheric pollution coefficient Z=3 for a latitude region of 50O. The individual curves show a characteristic day of the month in clear and sunny weather. The dashed line represents the pattern of diffuse radiation intensity in the months of June and December. Diffuse radiation in clear weather (by definition, it always occurs) does not generally exceed 100 W/m2, which is about 10% to 15% of the total radiation.
| Typical values of total radiation intensities | ||
|---|---|---|
| Blue sky | 800 - 1000 W/m2 | diffuse fraction 10% |
| Foggy sky | 600 - 900 W/m2 | diffusion rate up to 50% |
| Foggy autumn day | 1002 | Diffusion ratio up to 100% |
| Cloudy winter day | 50 W/m2 | diffusion rate up to 100% |
| Year-round average | 600 W/m2 | diffusion rate 50-60% |
Possibilities of using solar energy
Assuming that the solar powered equipment will operate all year round, it is necessary to focus on powering it in the month of December, when there are the fewest sunny days and the shortest day, so as to avoid failure. Furthermore, a maximum of 17% efficiency of converting solar radiation into electricity must be taken into account (other influences - such as the tilt of the panel - are not considered here for simplicity). The following table shows the possible energy inputs at different times of the day and for different types of radiation (direct or diffuse) for a panel size of 1m2 in the month of December:
| type of radiation | Hour of the day | Total energy*) | ||||||||||
|---|---|---|---|---|---|---|---|---|---|---|---|---|
| 8 | 9 | 10 | 11 | 12 | 13 | 14 | 15 | 16 | 17 | 18 | ||
| Direct | 0 | 4,25 | 14,88 | 25,5 | 40,38 | 42,5 | 38,25 | 23,38 | 12,75 | 1,275 | 0 | 180Wh |
| Diffuse | 0 | 0,85 | 2,975 | 5,1 | 8,075 | 8,5 | 7,65 | 4,675 | 2,55 | 0,255 | 0 | 34Wh |
*) this is an estimate depending on the type of panels and their ability to process diffuse radiation.
 The table shows that the energy delivered in December on a sunny day is 180Wh and on a cloudy day is about 34Wh for a panel size of 1m2. For other sizes the power input needs to be recalculated.
In other words, if the solar panel size is 1m2, then the solar panel powered device can have a maximum average power input of 1.4W (in this case we do not consider losses in voltage converters, we do not distinguish between the position of the panel (see Figure 2) and losses in battery charging), which is the delivered solar energy budgeted for 24 hours. Thus, the minimum battery capacity must be able to store 26W of energy, which requires a minimum capacity of 2.2 Ah for a 12V battery, for example. Otherwise the device will fail due to lack of energy.
It follows that solar energy is not suitable for permanently powering LED or LCD panels at bus stops, except for e-paper based LCDs, but even these must operate in a "suitable" mode. It can, however, be used to power e.g. OAS 130 blind command receivers - see the opening picture.
An option to limit this is to have a larger battery connected to the system, which will be able to "cover" the lack of power supplied on cloudy days. With e.g. conventional lead-acid batteries, the life cycle of the battery needs to be taken into account. It would also be useful to determine its capacity on this basis:
- At 100% discharge - 250 cycles
- At 80% discharge - 350 cycles
- At 50% discharge - 550 cycles
For example, using a 12V lead-acid battery with a capacity of 12Ah, the maximum depth of discharge will be about 17%, which will ensure a long service life. In addition, for lead-acid batteries, "self-discharge currents" must be taken into account for solution calculations. Example of overlapping energy shortage - if we determine that there will be one sunny day in 15 normal days in December (diffuse radiation), we will get energy:
E= 14*34 + 1*180 = 656 W delivered in 15 days,
which allows us to increase the consumption to 1.8 W from 1.4 W, with a minimum battery of 44 Ah. This implies that if we require more power consumption of the equipment, the capacity of the batteries to power the connected equipment must be increased considerably during the winter months.
From a life cycle point of view, it is nowadays preferable to use lithium batteries with a suitable temperature range, e.g. LiFePo4, which have a much longer life cycle than conventional lead-acid batteries. However, these require a special control mechanism to manage these batteries. The description is here - the so-called battery management system - BMS. This system allows the status of the individual cells of an assembled battery to be monitored.
Conclusion
Solar cell powered equipment that needs to operate continuously must be truly low power or its operator must be satisfied with winter outages.
For public transport, this is particularly the case for e-ink, e-paper based markers, where such a marker is characterised by a power consumption of around 50-70mW and, with a suitable battery size, provides year-round operation - see the description of the ELP 19x or the stand-alone LCD K813.3.